Cashflow Report – Portfolio Income During September 2012

Welcome to the Investing for Cashflow Report – September 2012 Edition!

Each month, I review the portfolio income (i.e. paper income or income from investments) created from trading covered calls and create a “cashflow report” (hat tip to Pat Flynn over at Smart Passive Income). Analyzing trades is something every investor/trader should do on a regular basis, so this is my attempt to practice what I preach. The reports do the following:

  1. Help me track my progress towards financial independence
  2. Maintain my focus on increasing paper income and meeting my goals each month
  3. Provide an example of creating an income from investing/trading (actually making money!)
  4. Get your feedback on ways to improve

Enjoy!

Overview of September 2012

Not a lot going on in September.  I guessed correctly that the markets would rise due to the European Central Bank and US Fed actions, but that is not an investing strategy. So I remained on the sidelines for most of the month, and let the QE events unfold.

The general markets (DJIA, NASD, SP500) were pretty quiet last month.  Trading volume remained lower than average and prices rose in small increments when not reacting to the news.

Insights & Lessons Learned in September

I spent some time playing with spreadsheets last month, trying to creating new entry and exit signals. I ended up going with some really basic trendlines, so I no longer have to draw them by hand. You can see the results of my efforts in September’s last technical analysis.

The spreadsheets use actual closing prices, and then I played connect the dots for short term and mid term trends. Taking the change in price between two lows (or highs) and dividing it by the number of trading days in between gives me a price change per day. I then extend the price forward in time to the next option expiration date, creating a trendline and giving me stops for my underlying positions.

Not only do I have price targets for my stops, but I also can calculate how far away from the trendline an ETF is currently trading. This will be great for determining whether the covered call trade is worth the risk. I already calculate the percent return provided by covered call premiums. Now, I can compare that to the loss I would need to endure before the underlying ETF reached the trendline (i.e. my new stop price). If an ETF is 15% above its trendline and the covered call only yields 5%, the overall trade could lose 10% before the ETF found support or broke the trendline.

Don’t get me wrong here. Leveraged ETF’s are volatile, so this new trendline calculation is not fool-proof…it is just more responsive than my other program and allows me to control my losses a bit more.

Cashflow Report – Portfolio Income During September 2012 – Breakdown:

DRN-Direxion Daily Real Estate Bull 3X (ETF)

Premiums = $0.00
Dividends = $0.00

EDC-Direxion Daily Emerging Markets Bull 3X (ETF)

Premiums = $0.00
Dividends = $0.00

ERX-Direxion Daily Energy Bull 3X Shares (ETF)

Premiums = $209.36
Dividends = $0.00

FAS-Direxion Daily Financial Bull 3X Shares (ETF)

Premiums = $173.36
Dividends = $0.00

TMF-Direxion Daily 20+ Yr Trsy Bull 3X Shares (ETF)

Premiums = $0.00
Dividends = $0.00

Cashflow = $382.72
Estimated Capital Gains/Losses = (307.05)

Goal Not Achieved

My ERX position was down ~$2 at the end of the month and my earlier FAS position ended up with a small capital loss on the underlying position. So my actual return came out pretty small. We’ll have to see where ERX ends up this month before calling it a wash.
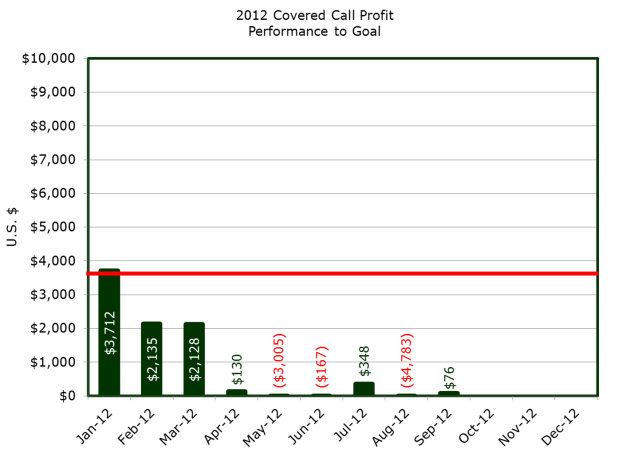
 
Bar chart showing year to date returns from covered calls
GOAL: Execute a covered call trading strategy that creates profit greater than $3,600 USD per month and deposits $3,600 USD per month into an expense account, for 3 months straight.

The Road Ahead

I kicked off September with one position in FAS (which was assigned), and then waiting for the smoke to clear from the QE craze that took hold. Towards the end of the month, I took my own advice and entered a position in ERX when it found support at my newly designed trendline.

Related Posts

Cashflow Report – Portfolio Income During August 2012

Welcome to the Investing for Cashflow Report – August 2012 Edition!

Each month, I review the portfolio income (i.e. paper income or income from investments) created from trading covered calls and create a “cashflow report” (hat tip to Pat Flynn over at Smart Passive Income). Analyzing trades is something every investor/trader should do on a regular basis, so this is my attempt to practice what I preach. The reports do the following:

  1. Help me track my progress towards financial independence
  2. Maintain my focus on increasing paper income and meeting my goals each month
  3. Provide an example of creating an income from investing/trading (actually making money!)
  4. Get your feedback on ways to improve

Enjoy!

Overview of August 2012

August saw TMF move against my covered call position, wiping out the rest of my profit for the year.  And I am now into my 5th month of sub-par returns.  Considering the Buy/write index (Powershares ETF – Ticker PBP)  is only up 4% this year, I’m not doing too badly…but that doesn’t mean I’m happy with my performance either.

The general markets (DJIA, NASD, SP500) were pretty quiet last month.  Trading volume remained lower than average and prices rose in small increments.

Lessons Learned in August

My 2012 experiment of using my trading program to capture capital gains  is not working.

As I’ve mentioned before, leveraged ETFs inherently have a lot of price volatility.  That volatility is the reason I can generate large percentage returns selling calls each month.   However, the capital losses that can result from holding these ETFs for a month is usually larger than the potential cashflow.

A pattern has emerged, and it follows a sequence:

I buy a leveraged ETF and sell a call.   In order to maximize cashflow, I could sell the first in the money call.  In order to maximize capital gain, I could sell the first out of the money call (assuming my first priority is still cashflow).  The ETF falls in price.  The price drop is large enough to absorb all the income from selling a call, resulting in an overall loss on the trade.  The option expires, and I am left with an ETF that is trading at a price well below my purchase price.  I sell another call for the next month, but the 2nd premium is not large enough to offset the first loss.

Before January 2012, I held risk-adjusted positions in all 5 ETFs.  At the beginning of each option cycle, I would sell calls against all 5 positions.  During downtrends in the general markets, in the money calls were used.  During up trends, near the money calls were used.  Usually, the ETFs did not fall at the same time, so the cashflow from selling calls covered most of the capital losses (if any) each month.

The 2012 adjustment attempted to lock in more “capital gains”.  I used risk adjusted positions in the 5 ETFs, but only if the ETFs had generated a buy-signal from using a price channel.  I would also close out a position if a sell signal was generated.  After a review of my results this year, I’ve noticed that using my price channel program has limited capital losses AND gains.  Because of the volatility, leveraged ETFs can recover from large drops in price very quickly (minor uptrends) and offer potentially profitable trades that I do not capture.

By limited the number of ETF’s I own, the diversification offered by holding all 5 ETFs is lost.  When I first started out, I had money in all 5 positions.  Some were up, some were down, but in the end, I was usually coming out ahead.  Now, I am only in 1 or 2 etf’s because I do not have a buy signal.  So when I lose money on one trade, I do not have the premiums/gains from other trades to reduce the losses.

Live and learn.  I need to use different signals – to come up with a new way to determine when a leverage ETF is a “buy” and when it is a “sell”.   At this time, my simple trend lines do a better job than price channels, so I will return that that for the time being while I evaluate other techniques.

I also need to focus less on capital gains, and more on limiting losses.  Capital gains are nice, but “investing for cashflow” was intended to create an asset that could fluctuated in value and still produce cashflow every month.  If I want to make money with capital gains, I should just trade equities and not worry about options.

Another important lesson learned is the number of months that could pass between hitting my cashflow goals.  Right now, I would need at least a 7 month cushion ($25,200) just to cover expenses…and that doesn’t include the losses from trading.

Cashflow Report – Portfolio Income During August 2012 – Breakdown:

DRN-Direxion Daily Real Estate Bull 3X (ETF)

Premiums = $0.00
Dividends = $0.00

EDC-Direxion Daily Emerging Markets Bull 3X (ETF)

Premiums = $0.00
Dividends = $0.00

ERX-Direxion Daily Energy Bull 3X Shares(ETF)

Premiums = $0.00
Dividends = $0.00

FAS-Direxion Daily Financial Bull 3X Shares(ETF)

Premiums = $347.72
Dividends = $0.00

TMF-Direxion Daily 20+ Yr Trsy Bull 3X Shares (ETF)

Premiums = ($36.31)
Dividends = $0.00

Cashflow = $311.14
Capital Gains/Losses = ($5,094.81)


Goal Not Achieved

GOAL: Execute a covered call trading strategy that creates profit greater than $3,600 USD per month and deposits $3,600 USD per month into an expense account, for 3 months straight.

The Road Ahead

I am kicking off September with nothing on the balance sheet. I’ve been trading weekly FAS options due to their short duration.  I don’t feel comfortable entering longer-term positions. Between the Fed’s upcoming announcement about QE and the uncertainty surrounding ECB/Germany monetary actions, I’m content to sit on my hands see what happens.

Related Posts

Cashflow Report – Portfolio Income During July 2012

Welcome to the Investing for Cashflow Report – July 2012 Edition!

Each month, I review the portfolio income (i.e. paper income or income from investments) created from trading covered calls and create a “cashflow report” (hat tip to Pat Flynn over at Smart Passive Income). Analyzing trades is something every investor/trader should do on a regular basis, so this is my attempt to practice what I preach. The reports do the following:

  1. Help me track my progress towards financial independence
  2. Maintain my focus on increasing paper income and meeting my goals each month
  3. Provide an example of creating an income from investing/trading (actually making money!)
  4. Get your feedback on ways to improve

Enjoy!

Overview of July 2012

I wish I had something new to report.  I wish that July was a fantastic month.  But wishing is not an investing or trading strategy.  I am now on my 4th month of sub-par returns.

The general markets have whipsawed back and forth since late March, which would normally be a good thing for covered calls.  However, using leveraged ETF’s has been as difficult as the market has been irrational.  Actually, I was looking good heading into the last week of the month.  I just couldn’t hold onto those capital gains.

Lessons Learned in July

Since this is the 4th month in a row of poor returns, it is time to evaluate my strategy again.  This is a habit I picked up from IBD.  After 3 straight losing trades, they recommend regrouping and figuring out what you’re doing wrong.

I started tracking my “return on investment” a few months ago to try and get a better sense of my performance.  A large portion of my portfolio has been on the sidelines, so it makes sense to evaluate my gains based on the money I have at risk in the market (cashflow + capital gains).

Jan =10.5%
Feb = 4.8%
Mar = 8.6%
Apr = 0.5%
May = -18.1%
Jun = -1.1%
Jul = 0.8%

As you can see, May was a pretty bad month with an 18% loss.  But that doesn’t tell the whole story, because I had very little money in the market.  So the return was small, but so was the position.  A positive takeaway is that I made the right decision by lowering the amount of money I had at risk.

Since my goal was to have $100,000 in a trading account (the level I thought was necessary for naked options), I used that number to calculate my “return on assets”, which shows the impact that my trading would have on an account with $100,000.  Here, the maximum loss I should ever see is 10%, since 2% is the max loss per position and I can hold up to 5 positions.

Jan = 3.7%
Feb = 2.1%
Mar = 2.1%
Apr = 0.1%
May = -3.0%
Jun = -0.2%
Jul = 0.3%

May was the only loss above 2%.  Since I held 3 positions at the start of the month and 2 ended up hitting sell limits, a 3% loss is within the loss limits I set.

Based on these numbers, my risk management system seems to be working correctly.

Cashflow Report – Portfolio Income During July 2012 – Breakdown:

Realized Paper Income Gains

DRN-Direxion Daily Real Estate Bull 3X (ETF)

Premiums = $363.72
Dividends = $0.00

EDC-Direxion Daily Emerging Markets Bull 3X (ETF)

Premiums = $0.00
Dividends = $0.00

ERX-Direxion Daily Energy Bull 3X Shares(ETF)

Premiums = $0.00
Dividends = $0.00

FAS-Direxion Daily Financial Bull 3X Shares(ETF)

Premiums = $0.00
Dividends = $0.00

TMF-Direxion Daily 20+ Yr Trsy Bull 3X Shares (ETF)

Premiums = $553.67
Dividends = $0.00

Realized Cashflow = $917.39
Capital Gain = ($599.11)
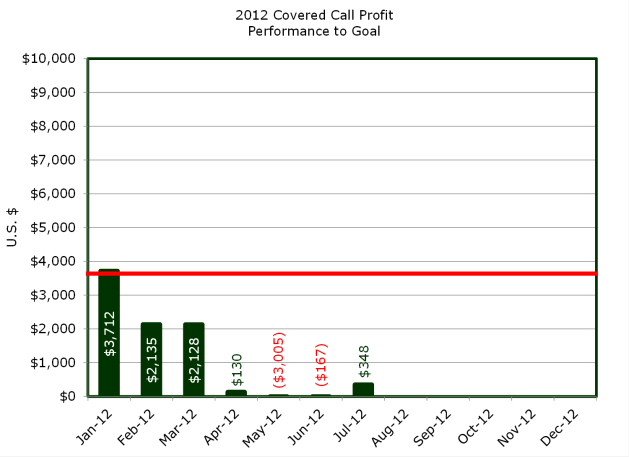
Profit = $348.28 (0.8% Return on Invested Capital)

Goal Not Achieved

Portfolio Income for July 2012 - Investing for Cashflow

GOAL: Execute a covered call trading strategy that creates profit greater than $3,600 USD per month and deposits $3,600 USD per month into an expense account, for 3 months straight.

The Road Ahead

One week into August and TMF is already falling.  Hard.  I could end up with another ugly month in August.  As bad as the last few months have been, they will lead to a better trading system overall.  And so far I’m still in the black for the year, so I can’t complain too much.  In the meantime, I’ll just keep plugging away.

Related Posts

March Paper Income – EDC Dividend

Direxion Daily Emerging Markets Bull 3X Shares (EDC) announced a short term capital gains distribution of $.64151 and a long term capital gains distribution of $0.01095 per EDC Share. The record date is March 22, 2011; payable date is on March 29, 2011.

Cashflow Report: Paper Income during February 2011

This month, I JUST missed my profit target! Considering my exposure to the market is ~80% (meaning I’m still sitting on some cash), I am REALLY happy with that result.

This month has reinforced the saying “Don’t fight the market”. While the general market seems to have stalled, DRN continues its march higher (reached $70).

On the other side, EDC has been moving sideways, but appears to be in a longer term downtrend. With the state of unrest and uncertainty internationally, it doesn’t appear that there is fundamental support for a rally.

But it doesn’t matter what I think. Regardless of whether I am right or wrong, I want to make money.

So without further delay, here is the profit report for February 2011:

Cashflow Breakdown:

DRN-Direxion Daily Real Estate Bull 3X (ETF)

Premiums = $2410
Dividends = $0.00
Commissions/Fees = ($25.20)

EDC-Direxion Daily Emerging Markets Bull 3X (ETF)

Premiums = $500.00
Dividends = $0.00
Commissions/Fees = ($11.32)

Net Cashflow – Feb 2011 = $2878.51

Cashflow Report – Paper Income during January 2011

2011 started off with a bang, and continued my success from the last quarter of 2010.

Cashflow Breakdown:

DRN-Direxion Daily Real Estate Bull 3X (ETF)

Premiums = $1660.47
Dividends = $0.00
Commissions/Fees = ($54.91)

EDC-Direxion Daily Emerging Markets Bull 3X (ETF)

Premiums = $629.90
Dividends = $0.00
Commissions/Fees = ($21.74)

Net Cashflow – Jan. 2011 = $2278.53

Commentary: A little short of my goal ($3,000 per month), but I’m pleased that I generated this level without TOO much risk.

December Paper Income – DRN Dividend

Using covered calls to supplement dividend investing is a strategy that I have tried in the past. My DRN trades were not made with that strategy in mind, but who doesn’t like a little extra income for Christmas?

  • DRN Dividend Ex Date: Dec-22-2010
  • DRN Dividend Record Date: Dec-27-2010
  • DRN Dividend Pay Date: Dec-30-2010
  • DRN Dividend Amount Current: $ 0.0542