Do What You Love in 2013

The Safe Investing Blog

Happy New Year!  Now that the parties are over, it’s time to review your achievements from last year, the things you want to do better, and what you’re no longer going to do.

But how do you know whether these goals are leading you to a place you want to go?

With that in mind, here is a great article to get your mind going now that your hangover is subsiding: How To Do What You Love (Paul Graham)

Finding work you love is very difficult. Most people fail. Even if you succeed, it’s rare to be free to work on what you want till your thirties or forties. But if you have the destination in sight you’ll be more likely to arrive at it. If you know you can love work, you’re in the home stretch, and if you know what work you love, you’re practically there.

View original post 47 more words

Stop Order Alert for TMF

TMF cut through the mid-term uptrend yesterday, so I bought back my call and sold my shares for a total loss of $749.35 (including option premiums, commissions, and fees).  Ouch!


Investing for Cashflow – December Technical Analysis

For those of you visiting for the first time, I use basic technical analysis to make trading decisions related to a covered call strategy. Each month after options expire, I review price and market action since the previous option expiration date, as well as any commentary from the previous month’s analysis.

Every investor and trader should review their trades on a regular basis, and this effort helps me improve my ability to “read the tape”.

Enjoy!

December Discussion – General Stock Market


The U.S equity markets have rallied nicely over the past 4 weeks.  I still think that corporate profits will be weak in the 4th quarter, but you can’t fight the market.  Just be prepared for any curve ball the fiscal cliff throws our way.

December Technical Analysis for DRN


Here were my thoughts on DRN in November:

DRN is still looking for support.  The current downtrend is fairly steep, so I expect to see some constructive price action within the next month or so.  Until that time, we’re still in a wait and see mode (red light).

December’s Chart:

DRN-2012-12-18

Soon after the last technical analysis, DRN experienced constructive price action, as expected.  Now we just need to wait for a trendline to emerge and DRN will be back in the green.

December Technical Analysis for EDC


November’s commentary:

That new, short term uptrend (June to September) was REALLY short.  EDC broke it over the last few trading sessions.  Now we wait for EDC to test the May-June trendine (high 70’s).    Given the U.S. markets’ recent weakness and all the turmoil overseas (European economy and tensions between Israel and Palestine), EDC gets red light status until it can show some positive price action.

December’s Chart:

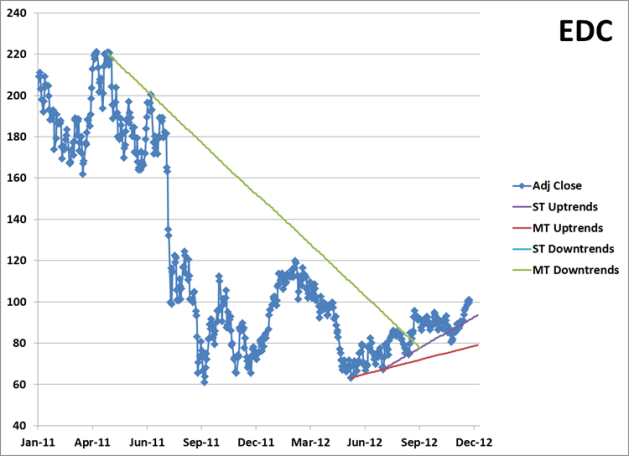
EDC-2012-12-18

After breaking the uptrend, EDC recovered and shot higher.  Unfortunately, this means that the ETF is very extended from potential support (~20%) and now is not the time to trade covered calls.  So we wait.

December Technical Analysis for ERX


November’s Commentary

The ERX price pattern continues to mimic DRN.  So the plan is the same; watch ERX for some new trends to emerge (red light).

December’s Chart:

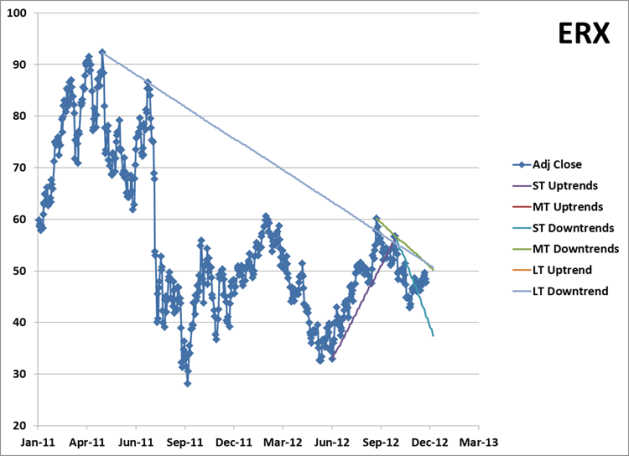
ERX-2012-12-18

ERX mirrored DRN and broke its downtrend since Novembers technical analysis.  So as with DRN, we’re now looking for a confirmation of a new short term uptrend.

December Technical Analysis for FAS


November’s Commentary

Those sell signals came in handy…FAS broke the mid-term uptrend and is now headed towards a support level in the high 80’s.  Since FAS is still fairly extended from mid-term support, red light status is the order of the day.

December’s Chart:

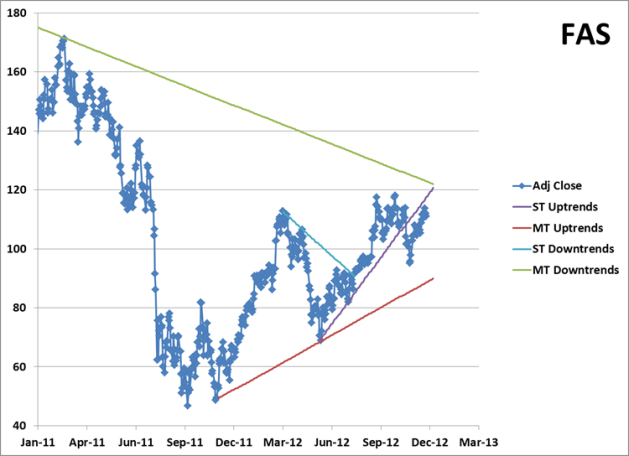
FAS-2012-12-18

After slicing through the uptrend, FAS followed the general markets higher.  The price has almost made it back to the level of the short-term uptrend. Usually, this is the time that the bottom falls out and we start another downtrend.  But we’ll have to wait and see.  For now, we’re looking for confirmation of the new uptrend, just like DRN and ERX.

December Technical Analysis for TMF


November’s Commentary

TMF found support from the Jul’11-Apr’12 uptrend, which is good news.  The bad news is that TMF is more than 10% away from the mid-term uptrend.  I expect TMF to come down in price, and either test the mid-term trend, or find a new short-term low (yellow light).

December’s Chart:

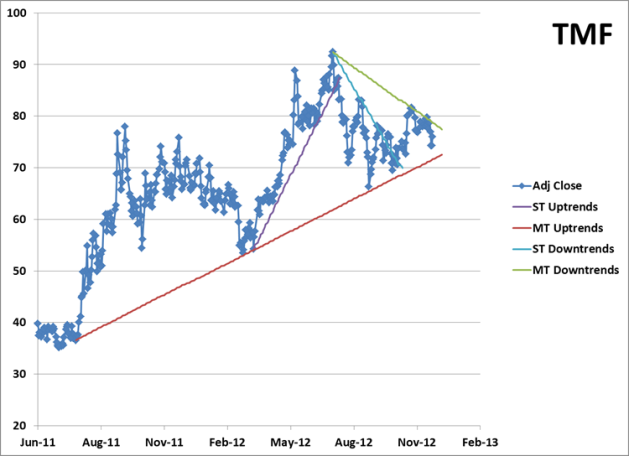
TMF-2012-12-18

TMF ran into a mid-term downtrend (July-November) and couldn’t break through.  The price is still above the current uptrend, so I’m on the look-out for a new short-term low (yellow light).

Summary


Green Light (Uptrend): None

Yellow Light (No Trend, Range Bound, or Extended from Trendline) : DRN, EDC, ERX, FAS, TMF

Red Light (Downtrend or Broken Trendline): None

Cashflow Report – Portfolio Income During November 2012

Welcome to the Investing for Cashflow Report – November 2012 Edition!

Each month, I review the portfolio income (i.e. paper income or income from investments) created from trading covered calls and create a “cashflow report” (hat tip to Pat Flynn over at Smart Passive Income). Analyzing trades is something every investor/trader should do on a regular basis, so this is my attempt to practice what I preach. The reports do the following:

  1. Help me track my progress towards financial independence
  2. Maintain my focus on increasing paper income and meeting my goals each month
  3. Provide an example of creating an income from investing/trading (actually making money!)
  4. Get your feedback on ways to improve

Enjoy!

Overview of November 2012

The general markets (DJIA, NASD, SP500) recovered from the October downtrend, making their way back to their respective 50 day moving averages.

Insights & Lessons Learned in November

I learned that my trading system isn’t as automated as I thought. I spent most of the month away from my trading desk, and subsequently missed out on some opportunities. This is a big miss because the market has been so choppy; opportunities have a very high probability of being short-term. On the plus side, I may have missed an exit signal as well, given my time constraints and inability to monitor the market daily.

Cashflow Report – Portfolio Income During November 2012 – Breakdown:

DRN-Direxion Daily Real Estate Bull 3X (ETF)

Premiums = $0.00
Dividends = $0.00

EDC-Direxion Daily Emerging Markets Bull 3X (ETF)

Premiums = $0.00
Dividends = $0.00

ERX-Direxion Daily Energy Bull 3X Shares (ETF)

Premiums = $0.00
Dividends = $0.00

FAS-Direxion Daily Financial Bull 3X Shares (ETF)

Premiums = $0.00
Dividends = $0.00

TMF-Direxion Daily 20+ Yr Trsy Bull 3X Shares (ETF)

Premiums = $2.30
Dividends = $0.00

Cashflow = $224.35
Estimated October Capital Gains/Losses = ($278.94)

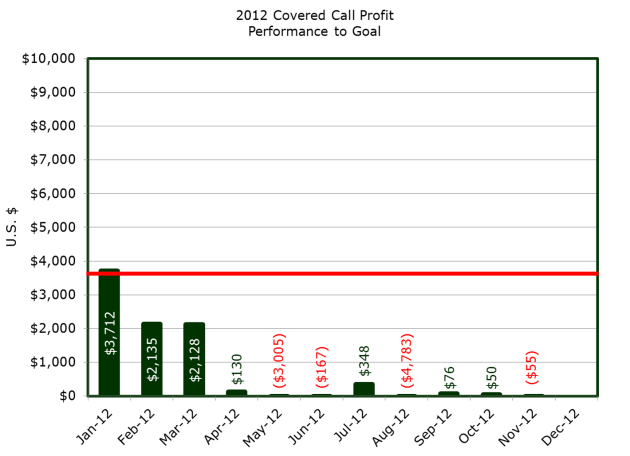
Goal Not Achieved

The month ended with TMF below my purchase price. My account balance shows a loss because the option premiums weren’t high enough to offset the loss in ETF value. This seems to be a recurring theme this year!

Bar chart showing year to date returns from covered calls

GOAL: Execute a covered call trading strategy that creates PROFIT greater than $3,600 USD per month and deposits $3,600 USD per month into an expense account, for 3 months straight.

The Road Ahead

With all the fiscal cliff talk, it is hard to separate the wheat from the chaff, so to speak. The markets have been in rally mode since the middle of November, volume has remained lower than average. To me, this indicates a lack of selling, rather than a large amount of buying.

Related Posts

December Option Investing – TMF Covered Calls

TMF was the only ETF I felt comfortable purchasing for December. We’ll see how it goes.

ETFs (Bought)

  • TMF – 100 shares @ $79.03

Calls (Sold)

  • TMF – 1 $80 call @ $2.30

Investing for Cashflow – November Technical Analysis

For those of you visiting for the first time, I use basic technical analysis to make trading decisions related to a covered call strategy. Each month after options expire, I review price and market action since the previous option expiration date, as well as any commentary from the previous month’s analysis.

Every investor and trader should review their trades on a regular basis, and this effort helps me improve my ability to “read the tape”.

Enjoy!

November Discussion – General Stock Market


The general U.S equity markets continued to fall over the past 4 weeks.  The 3rd quarter was the worst quarter for corporate profits in 3 years, and there is no reason to expect the 4th quarter to be much better.  Until there are some signs of strength, protect your capital.

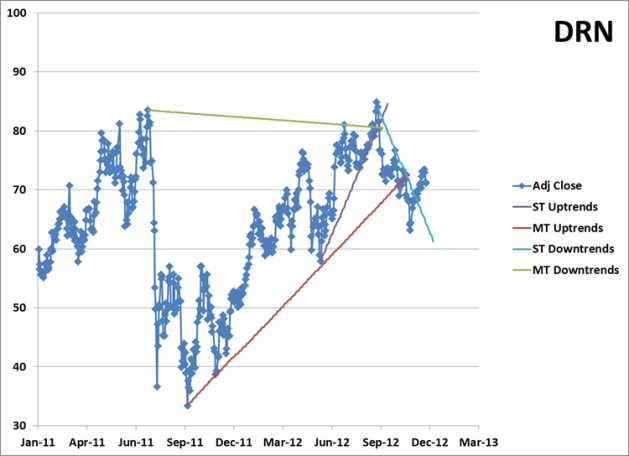
November Technical Analysis for DRN


Here were my thoughts on DRN in October:

DRN was still working its way down to the Sept-Dec-June uptrend when options expired on the 19th.  As of the 26th, DRN failed to find support and broke the uptrend, giving us a new, short-term downtrend.  All we can do with DRN is watch and wait (red light).

November’s Chart:
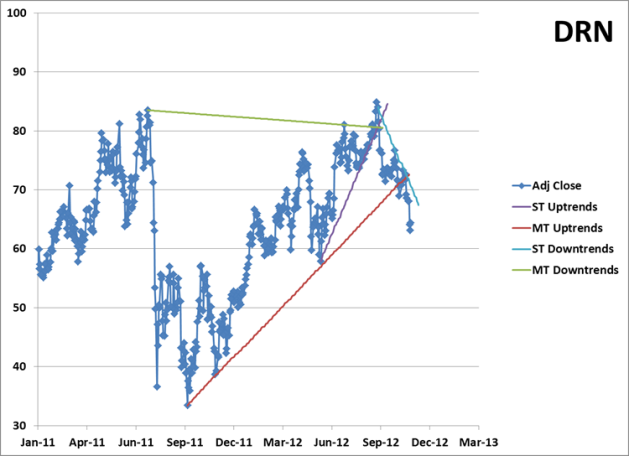
Price Chart for DRN with Trendlines

DRN is still looking for support.  The current downtrend is fairly steep, so I expect to see some constructive price action within the next month or so.  Until that time, we’re still in a wait and see mode (red light).

November Technical Analysis for EDC


October’s commentary:

EDC traded sideways in October, staying between the high 80’s and low 90’s.  It appears that there is a new short term uptrend (June to September), and EDC’s price is only 5% above that mark.  A new uptrend would move the the May-June trendine to a mid to long-term uptrend (still in the mid-70’s), which seems to be a better fit given the uptrend’s small slope.  This new development makes EDC a green light for October, which is an improvement from September’s yellow light status.

November’s Chart:
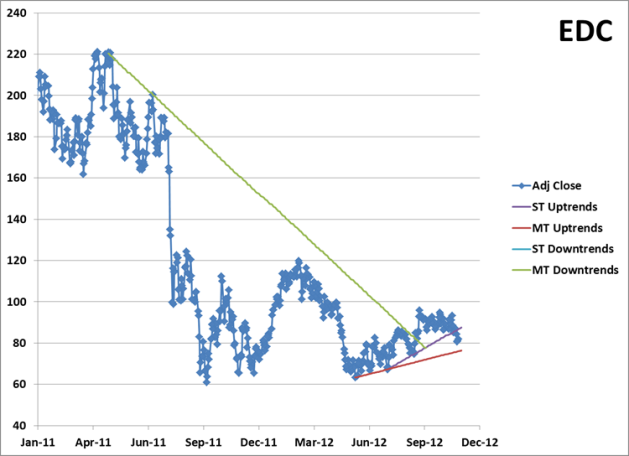
Price Chart for EDC with Trendlines

That new, short term uptrend (June to September) was REALLY short.  EDC broke it over the last few trading sessions.  Now we wait for EDC to test the May-June trendine (high 70’s).    Given the U.S. markets recent weakness and all the turmoil overseas (European economy and tensions between Israel and Palestine), EDC gets red light status until it can show some positive price action.

November Technical Analysis for ERX


October’s Commentary

ERX fell back to June-September uptrend and found support for a few days.  Unfortunately, that support didn’t last long; ERX broke the uptrend and forced me to sell.  There was a brief rally back to that same uptrend, which has now become a new level of resistance.  As with DRN, we can only watch ERX for the time being and wait for some new trends to emerge (red light).

November’s Chart:
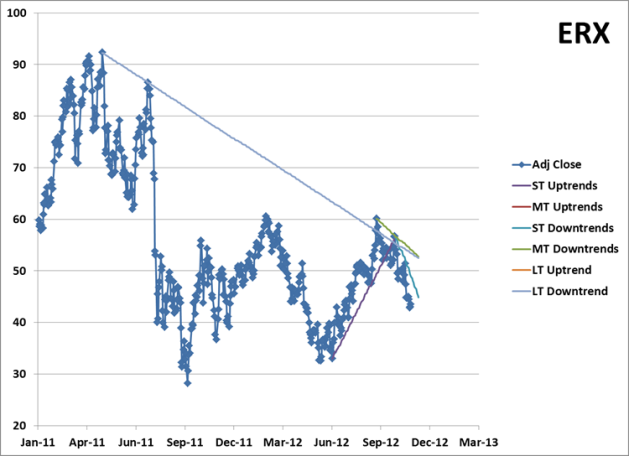
Price Chart for ERX with Trendlines

The ERX price pattern continues to mimic DRN.  So the plan is the same; watch ERX for some new trends to emerge (red light).

November Technical Analysis for FAS


October’s Commentary

The price of FAS is within a few percent of the short term uptrend, so we’ve entered buy territory.  But be careful – the mid-term uptrend is down in the mid-80’s, so a steep sell off could occur if we break the short term trendline.  Keep your sell signals at the ready if you do decide to enter a position.

November’s Chart:
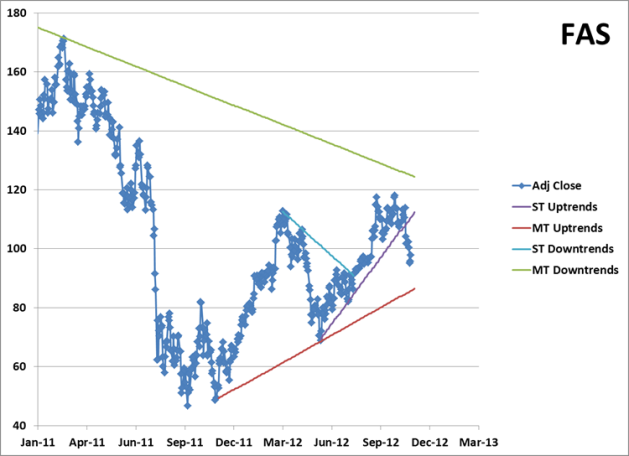
Price Chart for FAS with Trendlines

Those sell signals came in handy…FAS broke he mid-term uptrend and is now headed towards a support level in the high 80’s.  Since FAS is still fairly extended from mid-term support, red light status is the order of the day.

November Technical Analysis for TMF


October’s Commentary

TMF broke the short-term downtrend (July-September) I mentioned last month , but prices were unable to make much headway.  Instead, TMF spent most of the month between $70-$75 per share.  Since the downtrend is broken, I’m more bullish on this ETF.  But I also want to see TMF find support from the Jul’11-Apr’12 uptrend.

November’s Chart:
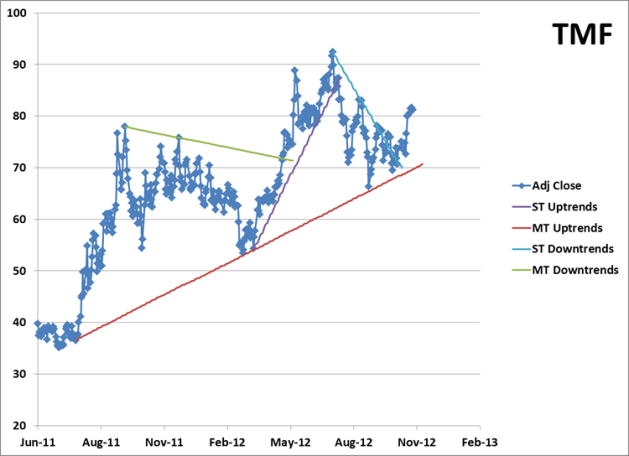
Price Chart for TMF with Trendlines

TMF found support from the Jul’11-Apr’12 uptrend, which is good news.  The bad news is that TMF is more than 10% away from the mid-term uptrend.  I expect TMF to come down in price, and either test the mid-term trend, or find a new short-term low (yellow light).

Summary


Green Light (Uptrend): None

Yellow Light (No Trend, Range Bound, or Extended from Trendline) : TMF

Red Light (Downtrend or Broken Trendline): DRN, EDC, ERX, FAS
Cashflow Report – Portfolio Income During October 2012

Welcome to the Investing for Cashflow Report – October 2012 Edition!

Each month, I review the portfolio income (i.e. paper income or income from investments) created from trading covered calls and create a “cashflow report” (hat tip to Pat Flynn over at Smart Passive Income). Analyzing trades is something every investor/trader should do on a regular basis, so this is my attempt to practice what I preach. The reports do the following:

  1. Help me track my progress towards financial independence
  2. Maintain my focus on increasing paper income and meeting my goals each month
  3. Provide an example of creating an income from investing/trading (actually making money!)
  4. Get your feedback on ways to improve

Enjoy!

Overview of October 2012

The geneal markets (DJIA, NASD, SP500) entered a downtrend in October after running into institutional selling early on. And we had a shortened trading month with the markets closed in the aftermath of Hurricane Sandy.

After moving sideways for half the month, DRN solidified a new downtrend, as did ERX. EDC and FAS continued to find support around the 90 and 110 dollar level, respectively. TMF seems to have found support around $70 and may be ready to start a new uptrend in November.

Insights & Lessons Learned in October

My new method for creating trendlines appears to be working.  I avoided a capital loss of at least 10% last month on ERX.  I’m hopeful that it will work just as well on the profit side!  However, my trading will be less consistent, meaning that I won’t always be in the market.  I’m not sure how that will affect my ability to make money each month.

Cashflow Report – Portfolio Income During October 2012 – Breakdown:

DRN-Direxion Daily Real Estate Bull 3X (ETF)

Premiums = $0.00
Dividends = $0.00

EDC-Direxion Daily Emerging Markets Bull 3X (ETF)

Premiums = $0.00
Dividends = $0.00

ERX-Direxion Daily Energy Bull 3X Shares (ETF)

Premiums = $0.00
Dividends = $0.00

FAS-Direxion Daily Financial Bull 3X Shares (ETF)

Premiums = $0.00
Dividends = $0.00

TMF-Direxion Daily 20+ Yr Trsy Bull 3X Shares (ETF)

Premiums = $0.00
Dividends = $0.00

Cashflow = $0.00
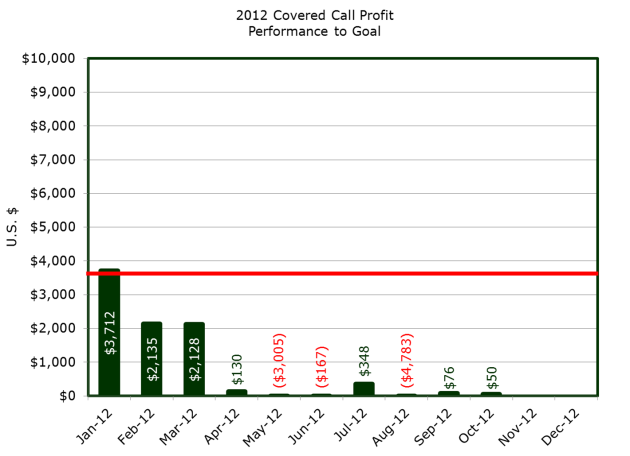
October Capital Gains/Losses = $50.31

Goal Not Achieved

After all was said and done last month, I ended up with a $50 capital gain on my ERX trade. Not even close to my goal, but it wasn’t a loss either!

Bar chart showing year to date returns from covered calls
GOAL: Execute a covered call trading strategy that creates PROFIT greater than $3,600 USD per month and deposits $3,600 USD per month into an expense account, for 3 months straight.

The Road Ahead

I’m continuing to monitor EDC and FAS.  They’re both close to my trendlines, so now is a good time to enter a position.  But only two weeks left to option expiration for November, I’ll have to make sure that the premiums will cover potential losses.

Related Posts